

Years ago, I (temporarily) gave up beach-going dole-bludgery to take a job indoors, inside an office building. Ensconced in climate-controlled stability, the weather had never seemed less relevant. And yet, never had I heard it spoken about so often. Discussing the conditions outside was a sort of social lingua franca amongst co-workers, with updates and opinions shared irrespective of for how many hours yet that person would remain stuck indoors at their desk.
My colleagues were far from unique in going online to keep an eye on the weather. Most of us check current conditions and/or forecasts at least once every day. As this information underpins decisions we make, like how to dress or what activities to do, we want to have an accurate understanding of what the weather reports are telling us. In this article, we unpack these reports to explore elements that are sometimes misunderstood, or that benefit from clarification.
Humidity
100% humidity sounds unpleasant, right? It’s not so simple.
When I was a kid, I wondered why the sky didn’t turn into an ocean when the humidity reached 100%. Sounds weird I know but follow my logic: humidity is how much moisture is in the air, water is surely 100% moisture, and so if the humidity is 100% then the air should now be water. Right?
Well, what child-Banno didn’t realise is that it is the relative humidity that is reported. That is, how much moisture is in the air relative to the maximum it can hold. And this maximum is never enough to turn the sky into a lake. Further, this maximum isn’t constant but rather changes with temperature – warm air can hold more water than cold air.

We all know that we sweat to keep cool. But it’s not the sweat per se that cools us, but rather it’s when our sweat evaporates. If there’s more moisture in the air then it is harder for our sweat to evaporate. Instead of evaporating and cooling us, the sweat piles up on our skin, which is why we get so sweaty in humid climates.
We mainly notice the humidity when it slows our sweat’s evaporation. And since its mostly in hot weather that we need to sweat, this is when we notice the humidity. That feeling of a humid day comes from there being both a high temperature and humidity, and not from the humidity alone.
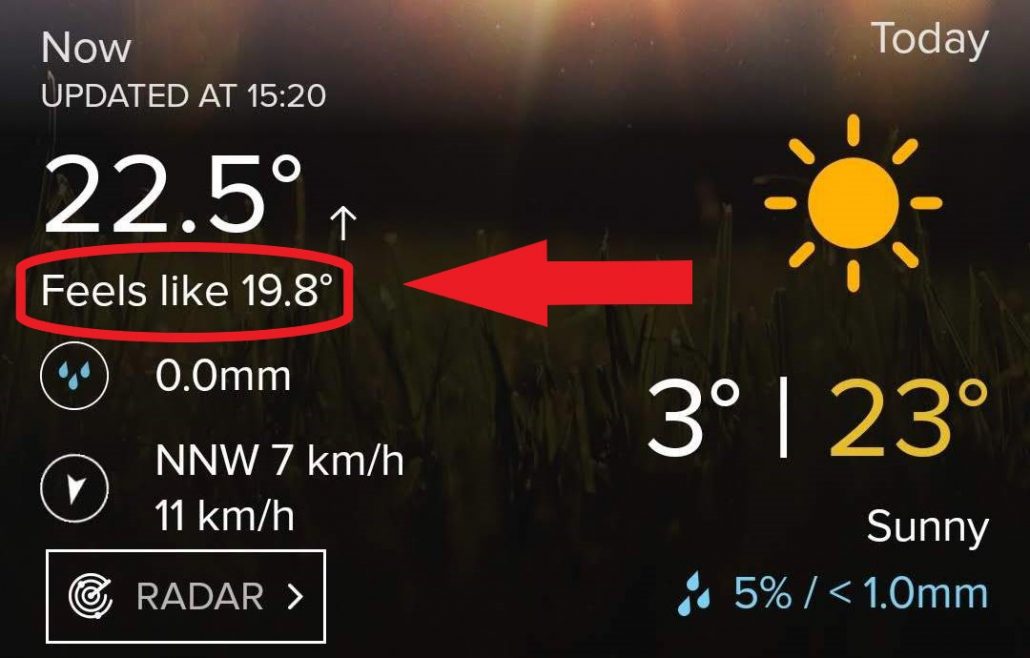
This is where the body comfort indexes come in, which you might have seen reported as ‘apparent temperature’ or ‘feels like’ temperature.
Apparent temperature aka ‘Feels like’
Most of us don’t care about the temperature and humidity for their own sake, but rather because they affect how comfortable we’ll feel. This leads to the use of body comfort indexes. By knowing the ‘feels like’ temperature, we get a better idea of how to prepare for the day.
For example, if a 20℃/68℉ day has 100% humidity then our level of discomfort will be the same as if it was a 24℃/75℉ day with low humidity. Yet as mentioned in the previous section, we really notice high humidity when it is paired with high temperatures. A body comfort index will reflect this. This time, if we couple 100% humidity with a 35℃/95℉ day then we get a larger jump in the ‘feels like’ temperature, to 50℃/122℉.
Tables are developed, like the one below, to show what each combination of temperature and humidity feels like. Not that this particular one would’ve been useful to the residents of Dhahran, Saudi Arabia when in 2003 high humidity combined with a 42℃/108℉ day to reach a staggering ‘feels like’ temperature of 81℃/178℉.
While humidity can increase the ‘feels like’ temperature, wind-chill can decrease it. This occurs because we’re surrounded by a thin layer of air heated by our own bodies, which the wind can whip away, making us feel colder.
- A fan blowing dry air generally can’t make anything cooler than the room temperature. They feel good to us in summer because the moving air boosts our body’s evaporation-based cooling system. But for everything in your house that doesn’t cool itself this way, the temperature will be essentially unchanged. So unless they are drawing in cooler air from another source, there’s generally no reason to have them on unless you’re in the room.
- The concept of wind-chill also helps with being smarter about when you keep your doors and windows open or shut. A breeze through the window on a warm day feels nice, but that air will feel warmer again once it has stopped moving. If a cool house is the goal, only open the doors and windows once the temperature is lower outside than inside, even if it seems to feel cooler in the breeze.
Of course there are many other relevant factors that can’t be included in the ‘feels like’ temperature, such as:
- The temperature of recently consumed food and drink;
- Your body mass;
- How conditions compare to what you’ve acclimatised to;
- Being wet will make you much colder; and
- Dark hair or clothing enhances heating from direct sun.
Minimum and Maximum temperatures
It’s obvious when you think about it, but the two figures that feature most prominently in weather reports are just the day’s extremes, which won’t necessarily reflect what the conditions at any other point. A forecast for 30℃/86℉ doesn’t necessarily mean a hot day, just that it’ll be hot at some point. Similarly, a low minimum doesn’t mean cold temperatures as soon as night comes. You’ll probably have been in bed for hours before it is reached.

A focus on minimum and maximum temperatures is sometimes the reason that a forecast may have appeared particularly inaccurate. For example, a cool change expected in the early evening probably won’t affect the day’s maximum temperature, as the temperature was already falling. But should the cool change arrive only a few hours earlier than anticipated then the usual warming throughout the day will be cut short. This results in a lower maximum temperature than forecast, suggesting considerable inaccuracy, though for most of the day (i.e. until the early arrival of the cool change) the temperature may have been as expected.
Terminology
The language used in weather reports will differ between organisations, but here are clarifications of a few terms used by the Australian Bureau of Meteorology:
- ‘Fine’ doesn’t mean pleasant, just no rain/snow/hail.
- ‘Early in the morning’ is defined with reference to midnight, not to the hours that most people keep. So if you’re still indoors at 7am, then whatever it was happened without you.
- ‘Cold’, ‘mild’, ‘very hot’ etc. are not absolute, but rather used with the reference to the location and time of year. That is, the same temperature may be described differently depending on the season.
- ‘Showers’ are short and may have sunny weather in between, while ‘periods of rain’ is actually rain for most of the time.
Rainfall
The next two sections are specific to forecasts issued by Australia’s Bureau of Meteorology. They often look like this:
Chance of any rain
The first thing to note is that the ‘chance of rain’ is the probability that it will rain at least once in the 24 hours starting from midnight. It’s not the chance that it will be raining in any given hour, or the chance it’ll rain while you’re awake. It also only considers ‘measurable rain’, which is at least 0.2 mm.

The chance of rainfall is calculated square-by-square for a huge grid covering Australia. Each grid square is no larger than 6km x 6km, and can be seen here. Any typical location within that square will have the quoted percentage chance of receiving some rain within the 24 hour period. For example, if your home is in a grid square with a 40% chance of rain, then you should have a 40% chance of it raining at least once at your home sometime in those 24 hours.

Note however that the estimate will be less accurate for locations that are unusual within that grid square e.g. at the coastline, on hilltops, or in deep valleys. Also, the forecasts are usually issued for areas/regions composed of multiple grid squares, meaning that the figures for each individual square must be merged in some manner.
Possible rainfall
If it does rain, then this is the volume expected at any place where rain falls. Where a range is provided, there is a 50% chance of at least the smaller volume falling, and a 25% chance of at least the larger volume falling.
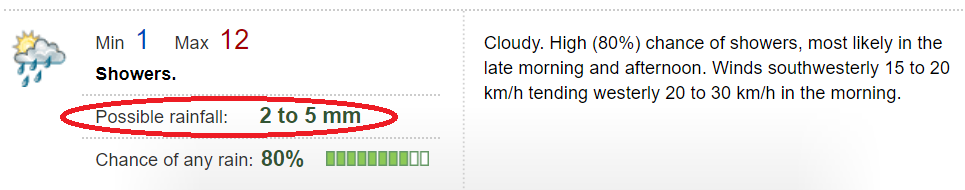
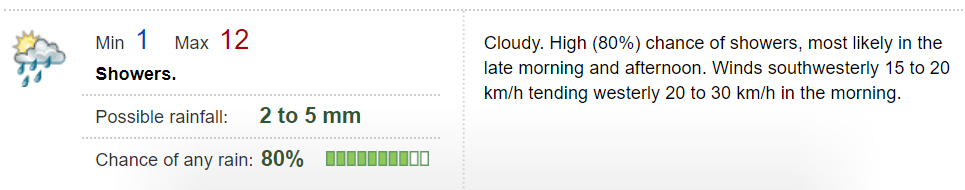
So in the example pictured above, if it does rain then there’s a 50% chance of at least 2mm falling, and a 25% of 5mm or more falling. Compare this to the large range in the following picture, which is typical of a forecast for thunderstorms.
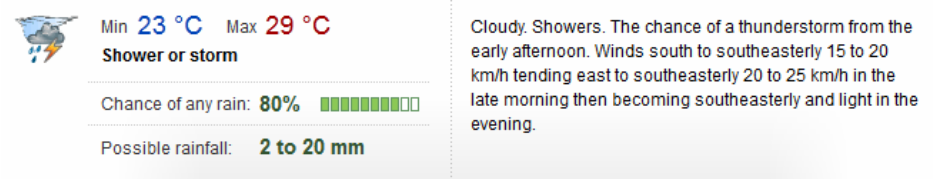
Combining the figures for both the possible rainfall and the chance of any rainfall, there’s a:
- 20% chance of no rainfall i.e. the storm(s) miss you completely;
- 30% chance of 0mm-2mm i.e. you caught the edge of a storm;
- 25% chance of 2mm-20mm i.e. you
- 25% chance of 20mm or more i.e. you got the full brunt of the storm(s).
Sometimes, like below, you’ll see that there is a chance of rain, but the expected rainfall forecast contains 0mm.

This forecast says that, assuming measurable rainfall does occur (i.e. the 40% chance comes true), then there’s a 50% chance of getting 0mm or less. Which obviously doesn’t make sense – if rainfall actually occurs then by default this means a 100% chance of getting at least 0.2mm (the minimum measurable amount). I couldn’t get a complete answer to what’s going on here, though partially it’s down to a convention of just reporting the expected rainfall as 0mm if rain is unlikely (less than 20-25%). But I’d say in practice, if 0mm is part of the forecast then you could pretty safely assume that no relevant amount of rain will fall, even if the forecast is telling you that there’s some chance of rain.
Stay positive when reading forecasts
A sunny, dry, calm, and mild day could be considered the baseline for weather forecasts. Forecasts tend to emphasise the departures from this baseline, such as rain or cloudiness, as well as the extremes in temperature. This draws our focus to the less comfortable aspects of the day ahead. But we can counter this bias by keeping the following points in mind:
- Partly cloudy is the same as mostly sunny (both apply when cloud cover is between 15% and 65%).
- Almost the entire day will be milder, perhaps substantially, than the forecast high and low temperatures.
- The chance of rain is for any time during the 24 hours, so unless indicated otherwise there’s a good chance that it will fall when you’re indoors.
So should you call off your lunchtime game of ultimate frisbee? Tomorrow’s forecast is partly cloudy, possible showers (40%), and min/max temps of 15℃/35℃. Remove the gloomy bias to rephrase it as ‘mostly sunny, temperature probably in the high 20s, and only a small chance of raining during the game’, and you’ve got your answer.

Key points
- Humidity matters really only matters when it’s hot.
- ‘Feels like’ temperatures assume you’re an adult in the shade, wearing appropriate clothes.
- Through their language and focus, forecasts can be overly pessimistic if you’re hoping for pleasant weather.
- For more on making informed choices about the weather in your daily life, check out our article on Why Do We Sunburn and Suntan?
Did you like this article?
Do you like this site?
Love it! I had been wondering how it was possible for apparent temperature to be higher than actual. And surprising that only a 25% chance of landing in the forecast rainfall range… Have you noticed how the forecast for a particular day in the 7 day forecast tends to be more dramatic further out and gets revised milder as the day draws closer?